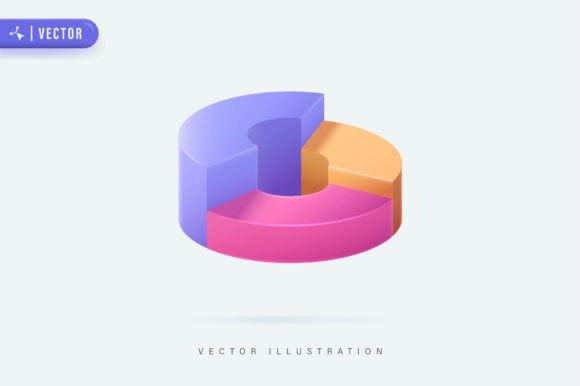
Visualize Data with Impact: 3D Realistic Donut Chart Illustrations
When you need to present data in a report, pitch deck, or infographic, the standard flat pie chart often falls short. It can feel generic, uninspired, and fails to capture the attention of a modern audience. This is where 3D Realistic Donut Chart Illustrations step in, offering a sophisticated solution for visualizing statistics with depth and clarity. Unlike basic geometric shapes, these illustrations provide a tactile, high-quality aesthetic that instantly elevates the perceived value of your content.
Beyond Basic Graphs: The Visual Appeal
The defining characteristic of this asset is its commitment to realism. We aren't just talking about a circle with a hole; we are looking at meticulously crafted vector shapes that mimic light, shadow, and volume. The "donut" style, which features a hollow center, is already superior to traditional pie charts because it allows for easier comparison of segment lengths and provides space in the center for key metrics or labels.
However, the 3D Realistic Donut Chart Illustrations take this a step further. By utilizing gradients and perspective, these charts create a sense of physical presence on the page. This style bridges the gap between dry data and engaging visual storytelling. The file package is designed for professional versatility, containing 1 JPG file for immediate high-resolution use, alongside 1 AI file and 1 EPS file. Because these are 100% vector shapes, they are fully resizable without pixelation, ensuring your data looks crisp whether it’s on a mobile screen or a massive conference banner.
Strategic Applications for Designers and Brands
Understanding where to deploy these illustrations is key to maximizing their impact. Because the files are ready to be printed on stickers, apparel, posters, and banners, the applications are nearly limitless. For marketers and entrepreneurs, these charts are invaluable assets for quarterly business reviews or investor decks. Instead of relying on Excel’s default styling, you can present your growth metrics in a way that feels polished and intentional.
For those in editorial design or publishing, these illustrations break up text-heavy pages. A magazine article discussing economic trends or a blog post analyzing market share becomes significantly more readable when accompanied by high-quality graphic design assets. The visual hierarchy is immediately established: the eye is drawn to the colorful, 3D data before moving to the supporting text.
Furthermore, content creators and social media managers can leverage these assets for platform-specific content. Instagram carousels or LinkedIn infographics that utilize these realistic charts tend to stop the scroll. They convey a sense of authority and professionalism that standard screenshots of spreadsheets simply cannot match. Even small business owners can use these in local advertising or internal newsletters to make financial updates feel less intimidating and more visual.
Technical Flexibility and Editability
One of the strongest selling points of this package is the fully editable vector nature of the files. Provided in Illustrator 10 and EPS 10 formats, these charts are not static images. You have complete control over the color palette, segment sizes, and shadows. This is crucial for brand identity consistency. If your company uses specific hex codes for its marketing materials, you can easily adjust the chart to match, ensuring a cohesive look across all touchpoints.
This level of editability also supports better visual hierarchy. You can isolate a specific data segment, enlarge it, or change its color to draw attention to a key success metric. The RGB color profile included in the JPG ensures vibrant display on digital screens, while the vector formats allow for conversion to CMYK for print production without loss of quality. This adaptability makes the 3D Realistic Donut Chart Illustrations a practical addition to any designer's library of design assets.
Integrating Data Viz into Your Design Workflow
When incorporating these charts into your projects, consider the context of your modern typography. Data visualization should complement your text, not fight with it. The 3D nature of these charts adds significant visual weight, so pairing them with clean, legible sans-serif fonts for body copy is often a wise choice. This contrast ensures that the data pops while the explanatory text remains easy to read.
For branding purposes, consistency is key. If you adopt this realistic 3D style for one report or campaign, consider how it fits into your broader visual language. It suggests a brand that is modern, data-driven, and detail-oriented. It moves your visual output away from the flat design trends of the past decade and adds a layer of sophistication that can influence how your audience perceives your competence.
Ultimately, the goal of any visual asset is to enhance communication. These 3D Realistic Donut Chart Illustrations do exactly that. They transform abstract numbers into tangible, understandable visuals. Whether you are crafting a complex infographic, designing a poster for an event, or simply trying to make a report more engaging, having access to high-quality, editable, and realistic vector charts ensures that your data is not just seen, but understood and remembered.